Remember to include necessary libraries.
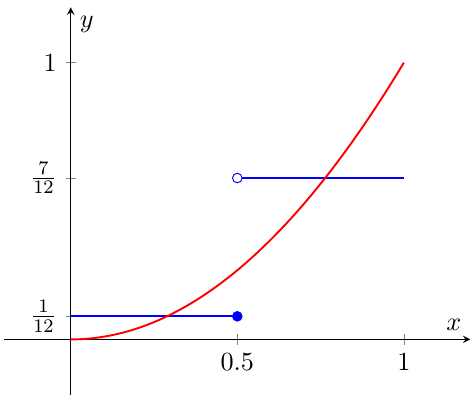
Here is an example from AMATH 391 assignment 1 with two functions (though I have some redundant codes…)
\begin{tikzpicture}[
declare function={
  func(\x)= (\x < 0.5) * (1/12)   + (\x=0.5)*(1/12)+
  (\x > 0.5) * (7/12)
  ;
  reals(\x) = (\x >= 0) * (\x^2);
}, scale=0.6]
\begin{axis}[
axis x line=middle, axis y line=middle,
ymin=-0.2, ymax=1.2, ytick={0,1/12, 7/12, 1}, ylabel=$y$, yticklabels = {$0$, ${1\over 12}$, ${7\over 12}$, 1},
xmin=-0.2, xmax=1.2, xtick={0,0.5,1}, xlabel=$x$,
domain=0:1,         samples=400,
% added
]

%\addplot [blue,thick] {func(x)};
\addplot[domain=0:0.5,blue, thick] {1/12};
\addplot [domain=0.5:1, blue, thick] {7/12};
\addplot[holdot] coordinates{(0.5,7/12)};
\addplot[soldot] coordinates{(0.5,1/12)};
\addplot [red, thick] {reals(x)};

\end{axis}
\end{tikzpicture}
will produce